Transformational Software Engineering Bootcamps
Making tech education accessible to all with online training in software development and AI tools.


Grow More Than Tech Skills
“When I first approached Hack Reactor, I just thought I’d get in and get out…then get a job. But to my surprise, I got so much more than I bargained for. I got a wonderful instructional team, cohort mates, and also learned how to code and problem-solve like an engineer.”
Software Engineering Bootcamps for the Workforce of the Future


Why Galvanize?
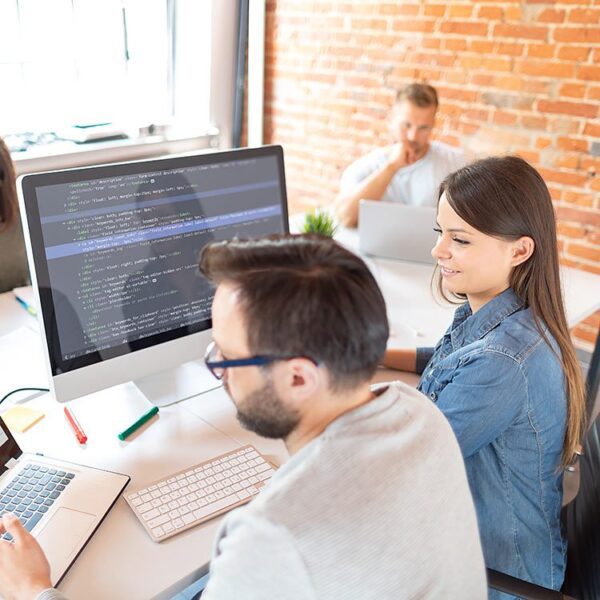
Coding Education for Every Background
Build your coding and career skills as you connect with a diverse community of students, instructors, staff, and alumni working together across industries.

Innovative Curriculum
In as few as 12 weeks, our software engineering bootcamp graduates learn in-demand coding skills and are ready to launch new carers in the tech sector.
Supportive Community
You’ll have access to a supportive and passionate community of students, instructors, staff, and alumni.
Embracing AI
We infuse our programs with AI tools like GitHub Copilot so you’re ready to thrive alongside advancements in AI. With expertise in industry-leading AI tools, you’ll have a competitive edge in the job market.
Making Tech Accessible to Everyone
Online coding bootcamps offer a path to transformation. If you’re willing to put in the work, you’ll find new career opportunities.
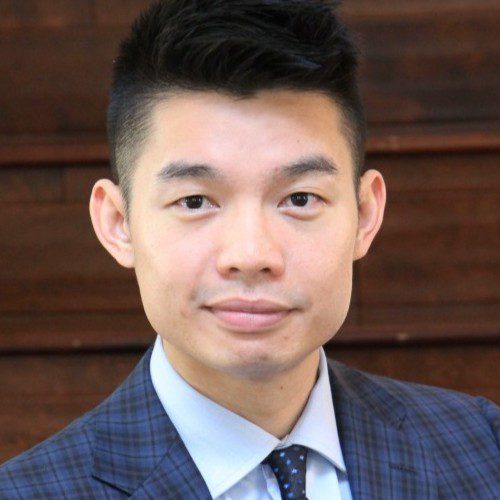
Featured Instructor
Julian Yuen on Helping Students Learn & Grow
Instructor Julian Yuen wants to give voice to students and help them use tech to make the world a better place.
“If a student fails to understand something, [we ask] why that is, and if needed, we adapt our curriculum. It could be providing more visuals, additional sprint work, or curriculum work to address the gaps in their knowledge…It’s a mix of not just delivering content but also gaining fast feedback on what’s working and what’s not to tailor our teaching accordingly.”
Julian Yuen | Hack Reactor Coding Bootcamp Instructor
Student Stories
Gain Confidence During a Software Engineering Bootcamp


Join Our Community
Accessible Tech Education for Underrepresented Populations
We help learners who are members of underrepresented populations make an impact through tech.

Full-Tuition Scholarships
Learn about our work with the Galvanize Foundation to fund full-tuition scholarships that seek to create new paths for members of underrepresented populations.
Telegraph Track Resources
Find out how we help underrepresented populations access resources and career connections with Telegraph Track.
Basic Prep Course
Start building on your JavaScript skills with this free prep course for applicants of our Intermediate Full-Time Coding Bootcamp.
Support for the Formerly Incarcerated
We support formerly incarcerated people through training programs in computer basics, programming, coding, and software development.
We Hack the Future
Transform Your Career Through a Software Engineering Bootcamp
Want to learn more? Sign up for an info session or schedule a 1:1 Q&A with an Enrollment Advisor to learn about our bootcamps.